How fuel price volatility shapes commercial aviation cost trends
Lead Author
Published
Views:
An airline can enter a financial year with strong bookings, disciplined staffing, and a profitable schedule, then see its outlook deteriorate before the peak travel season begins. The aircraft have not changed. Neither have the routes. What has changed is the price of the fuel required to operate them.
Fuel price volatility does more than raise an airline’s operating bill. It reshapes commercial aviation cost trends, influencing fleet investment, route profitability, working capital, and financial resilience. For business evaluators, the important question is not simply whether fuel prices are rising. It is how much exposure a carrier retains, how quickly it can respond, and whether its response improves long-term economics or merely postpones the pressure.
That distinction matters when assessing airlines, aircraft investments, airport markets, or next-generation propulsion technologies. A temporary price shock and a structural change in operating costs can produce similar headlines but require very different investment decisions.
The fuel price airlines pay is not the oil price in the headlines
Crude oil prices provide a useful starting point, but they do not fully describe airline fuel exposure. Jet fuel prices also reflect refining economics, regional availability, transportation costs, storage arrangements, and airport-specific supply conditions. The jet fuel crack spread—the difference between jet fuel and crude oil prices—can widen even when crude prices are relatively stable.
This creates an important evaluation trap: using an oil forecast as a direct proxy for an airline’s fuel bill. Refinery outages, changes in middle-distillate demand, or disruptions to supply routes can push aviation fuel costs away from the broader oil market.
Currency adds another layer. Fuel is commonly priced with reference to US-dollar markets, while many airlines earn substantial revenue in other currencies. A carrier may therefore face higher local-currency fuel costs without a comparable rise in the dollar-denominated benchmark.
A useful analysis separates three exposures:
- Commodity exposure: changes in crude oil prices and jet fuel refining spreads.
- Delivery exposure: regional premiums, airport supply charges, and procurement arrangements.
- Currency exposure: the mismatch between fuel-related payments and revenue currencies.
Two airlines operating similar aircraft can consequently report different fuel cost trajectories. Geography and procurement structure matter alongside engineering efficiency.
How fuel volatility moves through commercial aviation cost trends
The immediate transmission is straightforward: more expensive fuel raises operating expenditure for each flight. The wider effects are less linear. Fuel interacts with ticket pricing, capacity decisions, maintenance scheduling, financing, and liquidity, often on different timelines.
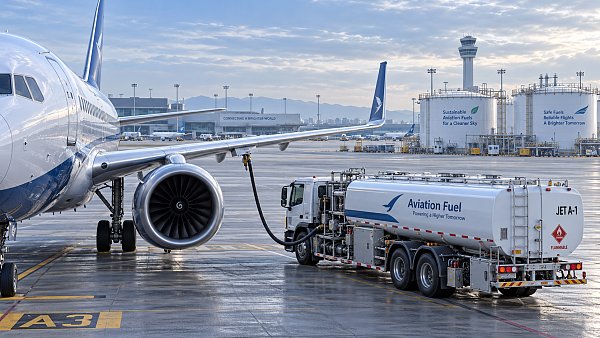
Ticket revenue does not necessarily adjust as quickly as fuel costs. Airlines often sell seats well before departure, leaving previously booked journeys exposed to subsequent price increases. Competitive pressure may also prevent carriers from recovering the full increase through fares. A fuel surcharge is a pricing mechanism, not proof of successful cost recovery.
The opposite situation deserves equal attention. Falling fuel prices may improve margins initially, but competitors can use the savings to reduce fares or expand capacity. Over time, some of the benefit can pass to passengers rather than remain with shareholders.
A sensitivity calculation that avoids false precision
Consider an illustrative airline whose fuel expenditure equals 25% of total operating costs. If its effective fuel price rises by 20%, while consumption and all other costs remain unchanged, total operating costs increase by approximately 5%. This is a scenario calculation, not an industry forecast.
The actual earnings effect depends on hedging, fare recovery, capacity adjustments, and operational changes. A business assessment should therefore show both the gross fuel sensitivity and the residual exposure after mitigation. Presenting only one number conceals the assumptions that determine the outcome.
Hedging buys planning time, not permanent protection
Fuel hedging can stabilize cash flows and create a more predictable budgeting window. It cannot remove the underlying economics of fuel consumption. Its value depends on the instruments used, the percentage of expected consumption covered, the duration of protection, and the relationship between the hedge benchmark and actual jet fuel purchases.
That last point is particularly important. A hedge linked to crude oil may perform differently from a carrier’s delivered jet fuel price. This basis risk can become more visible when refining spreads or regional supply conditions change sharply.
Hedging also introduces trade-offs. Some structures require premiums, collateral, or settlement payments. When market prices fall, a hedged airline may remain committed to higher effective costs while an unhedged competitor benefits sooner. When flying activity changes unexpectedly, hedged volumes may no longer match actual consumption.
For evaluators, the right question is not “Does the airline hedge?” but “Does its hedge policy fit its balance sheet, operating flexibility, and competitive environment?” Review coverage by period, settlement mechanics, collateral requirements, and how results appear in reported accounts. Accounting gains or losses should not be confused with the cash cost of operating the network.
Efficient aircraft become more valuable—but not automatically more economical
Higher expected fuel prices strengthen the financial case for lower fuel burn. More efficient engines, improved aerodynamics, lighter structures, and better mission matching can reduce exposure over an aircraft’s operating life. Yet the investment decision remains a whole-life cost comparison, not a contest between published fuel-efficiency claims.
A newer aircraft may require a higher purchase price or lease payment. Introducing it can add pilot training, spare parts, tooling, maintenance support, and temporary complexity from operating multiple fleet types. Delivery delays can also force an airline to retain older aircraft longer than planned.
Consequently, fleet renewal should be assessed against realistic missions: stage length, seating configuration, payload, airport conditions, and expected utilization. A fuel-burn improvement under one reference mission may not translate directly into the same economic gain across a carrier’s network.
Maintenance can alter the balance further. Engine deterioration affects fuel consumption, while shop visits, spare-engine availability, and unscheduled downtime influence both costs and usable capacity. An efficient aircraft that cannot reliably fly its planned schedule may produce disappointing financial results.
Within G-AIT’s technical benchmarking perspective, the useful bridge is between engineering performance and commercially deployable capability. For next-generation airframes or propulsion systems, evaluators should consider certification progress, support infrastructure, dispatch reliability, and operational limitations alongside projected efficiency. FAA or EASA certification requirements are not peripheral details; they help determine when a technology can enter service and under what conditions.
Route profitability changes before the network map does
Fuel volatility rarely affects every route equally. A service with strong premium demand, limited competition, and valuable connecting traffic may absorb higher costs better than a price-sensitive leisure route. However, neither distance nor aircraft size alone determines vulnerability.
Long-haul flights consume substantial fuel per departure, but they may spread costs across more seats and support higher-value demand. Short-haul services can face greater competitive pressure from rail or road transport and incur repeated takeoff-and-climb energy requirements. The relevant comparison is route-level contribution under realistic operating conditions.
Business evaluators should distinguish between avoidable flight costs and allocated overhead. A route appearing unprofitable after broad overhead allocation may still contribute positively to the network. Conversely, a service that looks attractive in isolation may lose value once connecting flows, aircraft positioning, or schedule constraints are included.
Capacity reductions also have limits. Cutting flights may lower fuel expenditure but spread ownership, staffing, and other fixed costs over less activity. Raising load factors is helpful only when the additional passengers generate sufficient revenue. Full aircraft are not necessarily profitable aircraft.
SAF adds a separate cost transition to an already volatile market
Sustainable aviation fuel introduces another dimension to airline fuel planning. Depending on the market, production pathway, incentives, and contractual structure, SAF can carry a price premium over conventional jet fuel. Policy obligations and corporate purchasing commitments can therefore increase expenditure even when conventional fuel prices decline.
This does not make SAF costs a simple extension of crude oil volatility. Feedstock availability, production capacity, conversion technology, logistics, and policy support create their own cost drivers. Procurement agreements may offer greater volume certainty, but they also introduce questions about pricing formulas, delivery terms, and counterparty performance.
Evaluators should keep two issues separate: the cost of meeting SAF-related obligations and the commercial value of lower lifecycle emissions. That value may include access to certain customer contracts or reduced exposure to particular emissions-related costs, but it should not be assumed without evidence.
Environmental claims also require careful boundaries. SAF does not eliminate aircraft fuel consumption or all flight emissions. Lifecycle outcomes depend on the pathway and applicable accounting framework. Similarly, electric or hydrogen propulsion should be evaluated against specific mission requirements, infrastructure readiness, and certification timelines—not treated as immediate substitutes across commercial aviation.
What a credible airline cost outlook should contain
A single fuel price forecast is too fragile a foundation for business evaluation. A more useful outlook tests several combinations of prices, demand, exchange rates, and operational performance. The objective is to identify where the business becomes vulnerable, rather than predict one exact market outcome.
At minimum, ask for the following:
- A transparent baseline: fuel volumes, benchmark prices, exchange rates, hedge coverage, and expected SAF procurement.
- Downside combinations: higher fuel costs alongside weaker demand, adverse currency movements, or aircraft downtime.
- Time-specific mitigation: what management can change within weeks, within a season, and over several years.
- Liquidity consequences: cash purchasing requirements, potential collateral calls, and financing headroom.
- Consistent unit metrics: costs with and without fuel, adjusted for stage length, capacity, and relevant accounting differences.
This last discipline prevents misleading comparisons. Cost per available seat kilometre can change because of aircraft configuration, network mix, or utilization, not just efficiency. Falling unit costs may conceal weaker yields; rising unit costs may reflect a deliberate move toward higher-value services.
The strongest signal is resilience across fuel scenarios
Fuel volatility will continue to shape commercial aviation cost trends, but it does not dictate the same outcome for every operator. The differentiators are practical: efficient aircraft suited to their missions, credible procurement and hedging policies, pricing power, operational reliability, and sufficient liquidity to withstand disruption.
For business evaluators, the most valuable finding is not that an airline benefits from cheap fuel. Almost every carrier does. It is that the business can remain commercially viable when fuel becomes expensive, revenue recovery is incomplete, and operational flexibility is constrained.
That is also the appropriate test for advanced aviation technologies: whether measurable technical improvements translate into durable economic value under realistic operating conditions. The strongest investment cases survive more than one fuel price forecast.
Article Categories
SYSTEM_ALERT_URGENT
Q3 SYMPOSIUM ON ORBITAL DYNAMICS
Registration for the Orbital Aerospace technical committee is now open. Node access required.
Recent Articles
![]() Oct 27, 2026FAA Certifies Boeing 737 MAX 10 After Years of DelaysFAA Certifies Boeing 737 MAX 10 After Years of Delays
 Oct 27, 2026Can an intermodal connectivity platform reduce rail handoff delays?Can an intermodal connectivity platform reduce rail handoff delays?
![]() Oct 26, 2026Chery Unveils Global Smart Mobility Strategy Targeting Robotaxis and eVTOLsChery Unveils Global Smart Mobility Strategy Targeting Robotaxis and eVTOLs
 Oct 26, 2026How to evaluate avionics for helicopters used in IFR operationsHow to evaluate avionics for helicopters used in IFR operations
![]() Oct 25, 2026Ukraine’s Defence Minister Says SpaceX Satellite Services Restored After Speed RestrictionsUkraine’s Defence Minister Says SpaceX Satellite Services Restored After Speed Restrictions
 Oct 25, 2026How satellite infrastructure for IoT affects sensor reporting delaysHow satellite infrastructure for IoT affects sensor reporting delays
![]() Oct 24, 2026China Successfully Launches Yaogan 50-03 SatelliteChina Successfully Launches Yaogan 50-03 Satellite
 Oct 24, 2026How gradients affect traction power needs in high-speed rolling stockHow gradients affect traction power needs in high-speed rolling stock
![]() Oct 23, 2026FAA Proposes Checks on Nearly 2,000 Boeing 737NGs Over Loss-of-Control RiskFAA Proposes Checks on Nearly 2,000 Boeing 737NGs Over Loss-of-Control Risk
 Oct 23, 2026How fuel choice affects specific impulse in liquid oxygen propulsionHow fuel choice affects specific impulse in liquid oxygen propulsion
![]() Oct 22, 2026QuantumScape Plans 100 MWh Solid-State Battery Line Targeting Aerospace and Other MarketsQuantumScape Plans 100 MWh Solid-State Battery Line Targeting Aerospace and Other Markets
 Oct 22, 2026How tank size limits hydrogen aircraft range on regional flightsHow tank size limits hydrogen aircraft range on regional flights
![]() Oct 21, 2026FAA Certifies Boeing 737-10, Clearing Regulatory Hurdle for DeliveriesFAA Certifies Boeing 737-10, Clearing Regulatory Hurdle for Deliveries
 Oct 21, 2026How are electric vertical takeoff aircraft certified in the US?How are electric vertical takeoff aircraft certified in the US?
![]() Oct 20, 2026Ohio Department of Transportation Releases Three-Year Advanced Air Mobility Action PlanOhio Department of Transportation Releases Three-Year Advanced Air Mobility Action Plan
 Oct 20, 2026How does magnetic flux density in tesla affect maglev lift force?How does magnetic flux density in tesla affect maglev lift force?
![]() Oct 19, 2026ZeroAvia Completes Key Ground Tests of ZA600 Hydrogen Fuel Cell PowertrainZeroAvia Completes Key Ground Tests of ZA600 Hydrogen Fuel Cell Powertrain
 Oct 19, 2026How spacecraft integration affects advanced propulsion costsHow spacecraft integration affects advanced propulsion costs
 Oct 18, 2026How chilldown prevents cavitation in cryogenic engine systemsHow chilldown prevents cavitation in cryogenic engine systems
 Oct 17, 2026How explainability affects algorithmic trust in AI flight systemsHow explainability affects algorithmic trust in AI flight systems
 Oct 16, 2026How to evaluate transportation technology for Middle East heatHow to evaluate transportation technology for Middle East heat
 Oct 15, 2026How common-cause failures defeat redundancy logic in European avionicsHow common-cause failures defeat redundancy logic in European avionics
 Oct 14, 2026How DO-160 applies to aerospace technology testing for avionicsHow DO-160 applies to aerospace technology testing for avionics
 Oct 13, 2026How fuel price volatility shapes commercial aviation cost trendsHow fuel price volatility shapes commercial aviation cost trends
 Oct 12, 2026How to qualify aerospace manufacturing components for traceabilityHow to qualify aerospace manufacturing components for traceability
 Oct 11, 2026Which certification hurdles are slowing hydrogen aviation in Europe?Which certification hurdles are slowing hydrogen aviation in Europe?
 Oct 10, 2026What evidence should a magnetic gap stability supplier provide?What evidence should a magnetic gap stability supplier provide?
 Oct 09, 2026Which ISO standards matter when qualifying industrial technology suppliers?Which ISO standards matter when qualifying industrial technology suppliers?
 Oct 08, 2026When does reusability actually lower launch vehicle costs?When does reusability actually lower launch vehicle costs?
 Oct 07, 2026Where to find reliable product knowledge resources in the Middle EastWhere to find reliable product knowledge resources in the Middle East
 Oct 06, 2026What drives high-speed rail systems cost per kilometer?What drives high-speed rail systems cost per kilometer?
 Oct 05, 2026When does hydrogen propulsion for UAV extend mission range enough to justify it?When does hydrogen propulsion for UAV extend mission range enough to justify it?
 Oct 04, 2026How rail systems integration reduces commissioning delaysHow rail systems integration reduces commissioning delays
 Oct 03, 2026How to evaluate an advanced propulsion manufacturer for hydrogen systemsHow to evaluate an advanced propulsion manufacturer for hydrogen systems
 Oct 02, 2026How to qualify aircraft components for OEM production approvalHow to qualify aircraft components for OEM production approval